Weekly Roundup

Weekly Roundup for June 1, 2021

One of the biggest updates to Power BI in the last year was deployment pipelines. That went a long way to making it a more enterprise-grade solution. Now you can automate the use of existing deployment pipelines. This would be very helpful for

  • Integrating those pipelines into Azure DevOps or GitHub,

  • Scheduling deployments,

  • Deploying multiple pipelines, and

  • Using cascading deployments.

Microsoft is still working on the ability to create pipelines from scratch and native integration into Azure DevOps.


Matthew Roche makes a really good point here (in a really interesting way) that the job of data governance is not to be a stumbling block in the way of deriving insight from data but to be an enabler of using data the RIGHT way, in a way that respects the sensitivities and the nature of the data therein.


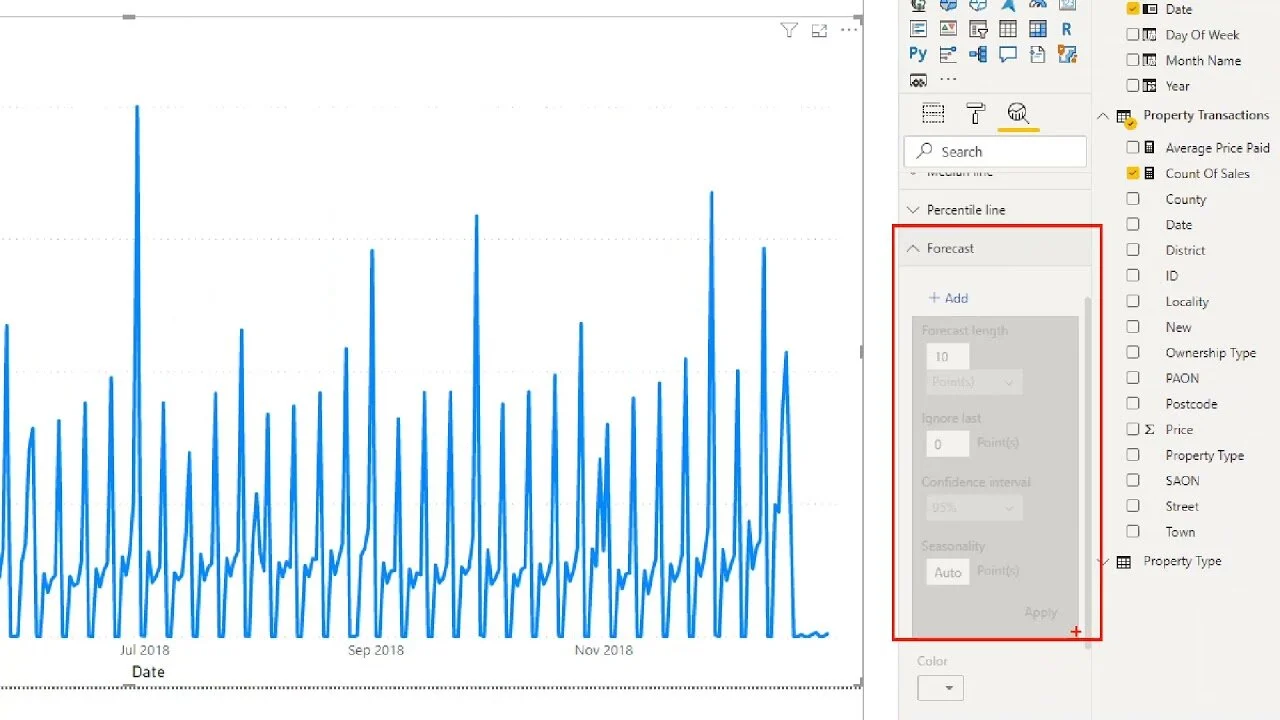
Patrick LeBlanc and Justyna Lucznik demonstrate the anomaly detection feature inside Power BI Desktop.


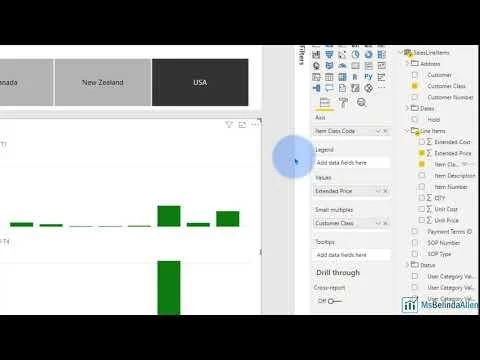
Adam Saxton gives you three different approaches to achieving dynamic axes in Power BI.

Weekly Roundup for May 24, 2021

In case you missed it, be sure to check out the Nashville Power BI user group meetup for May 2021 where Alex Powers helps improve your paginated reporting game in an hour.


Adam Saxton shows you all the tools you need to take your Power BI game to the next level:

Tools

  1. Power BI Desktop

  2. Performance Analyzer

  3. DAX Studio

  4. Vertipaq Analyzer

  5. Tabular Editor

  6. Best Practices Analyzer (just updated)

  7. ALM Toolkit

  8. Guidance documentation

Books

  1. The Complete Reference of Star Schema

  2. DAX Patterns

  3. The Definitive Guide to DAX


Chris Webb does a lot of work on improving query performance and refresh times within the broader Power BI ecosystem. He gave a talk at the recent SQLBits conference on the subject. Definitely worth a watch.


Microsoft has been making small updates to the Small Multiples visual every month since it came out. I was wanting someone to go over all the features comprehensively. Belinda Allen has done so in about four minutes.


Another great session from Chris Webb on some of the advanced features of Power BI, some of which many people don’t know even exist.


Adam Saxton helps people optimize their Power BI data models all the time. Here, he shows you his thought processes as he goes through the troubleshooting.

Weekly Roundup for May 17, 2021

The May 2021 feature summary for Power BI is out!


Don’t forget to sign up to hear Alex Powers go through the “Paginated Reports in an Hour” program. Join us *online* as we meetup again to share ideas around Power BI, Modern Excel, and Power Apps.

This month Alex Powers, Senior Program Manager of the Power BI Customer Advisory Team, joins to give us hands-on-keyboard training on paginated reports in Power BI. There are lots of occasions when paginated reports are called for over the "sliceable and diceable" reports you might be used to in Power BI, so this will be an invaluable technique in your BI toolset.

Paginated Reports in an Hour

This session will include a live hands-on-keyboard training for attendees, teaching you how to get started with creating Paginated Reports for Power BI to meet all your end user “Export-to” and Parameter based needs.

Follow Along URL: https://aka.ms/pbiworkshops

About: Alex Powers (Microsoft – Sr Program Manager)
From financial services to felines, the World Wide Web to professional wrestling – Alex Powers has an affinity for the conventional and unconventional when it comes to information. A self-proclaimed Excel and Power BI Enthusiast – Alex enjoys contributing to online forums, co-hosting the Power BI YouTube series Two Alex and sharing his passion for empowering others using Microsoft technologies.


In case you need ammunition to convince the powers that be at your organization that you should choose PowerApps for your no-code, low-code development platform, or that you should have a no-code, low-code platform in the first place, then check this out.


Be sure to sign up for Microsoft Build, May 25-27, 2021.


Patrick LeBlanc gives you a great primer on using DAX Studio to test out the measures you are trying to write in Power BI Desktop. Be sure to check it out.

Weekly Roundup for May 10, 2021

Here’s a recap of the major Power BI-related announcements at the Microsoft Business Applications Summit (MBAS), the biggest Power BI conference of the year.


This is one of the best Power BI-related tricks I’ve seen in a while. Patrick LeBlanc shows you how to very easily set up email subscriptions with RLS and roles.


Microsoft is introducing an entirely new component of Power BI — Goals. I’ll be curious to see how people use this. I think it could be particularly useful if users incorporate data driven goals and roll-up logic.


Adam Saxton shows you the current state of source control within Power BI. Good to know that Azure DevOps and GitHub integration are coming to Deployment Pipelines!


For any of you true geeks out there, you can now see the query plan use by Power Query Online. I’m looking forward to them bringing this to Power BI Desktop.


Required Reading: Marco Russo gives you the current state of the art for development tools for Tabular models (i.e., Power BI datasets) in 2021. For any serious Power BI developer, you need to read this.


Here is a comprehensive overview of all the announcements and new features at Microsoft Business Application Summit (MBAS).


Patrick LeBlanc shows you how to enable query folding for native SQL queries. This has the potential to have a significant performance boost.


You can now backup and restore Power BI datasets. This could be critical for various regulatory and reporting requirements that your enterprise may face.

Weekly Roundup for May 3, 2021

Join us *online* as we meetup again to share ideas around Power BI, Modern Excel, and Power Apps.

This month Alex Powers, Senior Program Manager of the Power BI Customer Advisory Team, joins to give us hands-on-keyboard training on paginated reports in Power BI. There are lots of occasions when paginated reports are called for over the "sliceable and diceable" reports you might be used to in Power BI, so this will be an invaluable technique in your BI toolset.

Paginated Reports in an Hour

This session will include a live hands-on-keyboard training for attendees, teaching you how to get started with creating Paginated Reports for Power BI to meet all your end user “Export-to” and Parameter based needs.

Follow Along URL: https://aka.ms/pbiworkshops

About: Alex Powers (Microsoft – Sr Program Manager)
From financial services to felines, the World Wide Web to professional wrestling – Alex Powers has an affinity for the conventional and unconventional when it comes to information. A self-proclaimed Excel and Power BI Enthusiast – Alex enjoys contributing to online forums, co-hosting the Power BI YouTube series Two Alex and sharing his passion for empowering others using Microsoft technologies.


Microsoft is now putting the Charticulator visual right in Power BI. That will make developing custom charts a lot simpler.


Adam Saxton has a tip for using buttons and bookmarks for changing (somewhat) the contents of a tooltip page. I thought this could have some interesting implications.


I’ve long advocated for the ability to take action within arms reach of where you make decisions. The new Power Automate visual for Power BI opens up endless possibilities to do just that, shortening the time between decision and impact.


I absolutely loved this! Have you ever had someone ask you for something, and you thought, “That’s probably not the best way to go about that?” Then, you have to talk them back down and into a solution that is workable and will actually solve their underlying problem, even though they well may not know what that problem is. Well, this post by Matthew Roche is for you.


For anyone working with PowerApps at a high level within your enterprise, this is something you will want to see. It is an adoption maturity model put together by the Power Customer Advisory Team (CAT) at Microsoft.


Patrick LeBlanc goes through the logic of how to highlight multiple values. This is a great example of how to tinker with the DAX logic to get the desired result.


Alberto Ferrari walks through troubleshooting some DAX code by walking through the filter context. When troubleshooting DAX, this is such an important exercise. Here, the expert himself shows how to do it through a specific example.


I thought this was a neat trick to color a line chart conditionally based on whether the number was positive or negative.

Weekly Roundup for April 19, 2021

MK_logo_horizontal_rgb.png

The May 2021 feature summary for Power BI is out!


About a year ago, I gave a presentation on data modeling in Power BI. I was lucky enough to have Alberto Ferrari in attendance. In our discussion afterwards, I remember him saying "Star schema all the things!" I couldn't agree more. Here's the explanation why.


Marc Lelijveld has a great demonstration of cross-report drill through in Power BI.


With environment variables for data sources, Power Apps and Power Automate solutions get that much closer to enterprise-grade. It allows for richer Application Lifecycle Management (ALM) capabilities.


Adam Saxton gives you a great primer for all things bookmarks in Power BI.

Weekly Roundup for April 12, 2021

MK_logo_horizontal_rgb.png

Watch Ben Gribaudo explaining “How Power Query Thinks” at the April 2021 meetup of the Nashville Modern Excel & Power BI User Group this Thursday. Click the link for the recording.


Radacad is putting on a five-day Power BI Summit. It’s only $98, so this is the one you won’t want to miss!


There have been tons of small updates to the model view in Power BI Desktop. Patrick LeBlanc gives a great overview of all the new features.


I have people who are always asking for resources about how to use Power BI if they’re unfamiliar with it. Patrick LeBlanc has a great introductory video for anyone who has never used Power BI before.

Weekly Roundup for April 5, 2021

MK_logo_horizontal_rgb.png

Power BI Deployment Pipelines have been improved to include:

  • Paginated reports management,

  • Data sensitivity labels, and

  • Teams can now deploy and update datasets (instead of the dataset owner).


Be sure to check out Ben Gribaudo explaining “How Power Query Thinks” at the April 2021 meetup of the Nashville Modern Excel & Power BI User Group this Thursday at 11:30 AM CDT. Click the link to sign up via Meetup in order to get the Zoom link.


Microsoft just released a Power Apps app to do a code review on your Power Apps apps. How meta! But seriously, it includes a customizable checklist of best practices, an automated analysis of the app, a code viewer, and a review of slow-performing queries.


Alberto Ferrari demonstrates a new update to the CALCULATE function that lets you easily apply multiple filter conditions.

Weekly Roundup for March 29, 2021

MK_logo_horizontal_rgb.png

Microsoft’s Business Applications Summit kicks off April 6. Be sure to sign up!


I don’t know how many times I’ve seen people load up reports with multiple card visuals. Not only is this not a great way to communicate information, but this also slows down the performance considerably. Alberto Ferrari shows you a better way.


You can now diff your PowerApps apps directly in the service!!


Patrick LeBlanc gives you three different, easy ways to work with smaller subsets of really large datasets in Power BI Desktop without utilizing Power BI Premium or Premium Per User.


This may not be for everyone, but as someone who will soon be responsible for a band new Power BI rollout, I found this white paper really informative. This gives Microsoft’s best practices for enabling PowerBI in Microsoft Teams within your organization.


You can now set sensitivity labels at your data warehouse level (in Azure Synapse Analytics) and have them flow down hill into (i.e., be inherited by) Power BI. Set them in one place, and those information protection labels follow the data where it goes.


Microsoft has made a few (small) welcome enhancements to the formula bar within the PowerApps editor.

  • Enter key adds a new line.

  • Tab key adds a tab more often.

  • They added a scrollbar.

Weekly Roundup for March 22, 2021

MK_logo_horizontal_rgb.png

Microsoft has released the March update to Power BI! Be sure to check it out.


The Power BI Embedded Playground has needed an update for a while. That update is now available. You can even edit the code right in the playground.


You can use any generic ODBC data source in Power BI Paginated Report Builder.


I love this idea of using Microsoft Forms as a dead-simple data input technique and then analyzing that data in Power BI.


Microsoft has released some very welcome enhancements to the Diagram View of Power Query Online.


I’m not familiar with Dremio, so I enjoyed reading Meagan Longoria’s analysis of it. In short, it is a tool for placing a semantic layer overtop a data lake. If you have a data lake or are thinking of moving in that direction, this is definitely something worth reading, though it seems that Dremio might need a bit of further maturity.


Adam Saxton has five ideas that every report designer should consider when building their reports.


Laura Graham-Brown at Hat Full of Data has a great listing of resources for anyone getting into paginated reports.