

Join us *online* as we meetup again to share ideas around Power BI, Modern Excel, and Power Apps.
This month Alex Powers, Senior Program Manager of the Power BI Customer Advisory Team, joins to give us hands-on-keyboard training on paginated reports in Power BI. There are lots of occasions when paginated reports are called for over the "sliceable and diceable" reports you might be used to in Power BI, so this will be an invaluable technique in your BI toolset.
Paginated Reports in an Hour
This session will include a live hands-on-keyboard training for attendees, teaching you how to get started with creating Paginated Reports for Power BI to meet all your end user “Export-to” and Parameter based needs.
Follow Along URL: https://aka.ms/pbiworkshops
About: Alex Powers (Microsoft – Sr Program Manager)
From financial services to felines, the World Wide Web to professional wrestling – Alex Powers has an affinity for the conventional and unconventional when it comes to information. A self-proclaimed Excel and Power BI Enthusiast – Alex enjoys contributing to online forums, co-hosting the Power BI YouTube series Two Alex and sharing his passion for empowering others using Microsoft technologies.

Microsoft is now putting the Charticulator visual right in Power BI. That will make developing custom charts a lot simpler.

Adam Saxton has a tip for using buttons and bookmarks for changing (somewhat) the contents of a tooltip page. I thought this could have some interesting implications.

I’ve long advocated for the ability to take action within arms reach of where you make decisions. The new Power Automate visual for Power BI opens up endless possibilities to do just that, shortening the time between decision and impact.

I absolutely loved this! Have you ever had someone ask you for something, and you thought, “That’s probably not the best way to go about that?” Then, you have to talk them back down and into a solution that is workable and will actually solve their underlying problem, even though they well may not know what that problem is. Well, this post by Matthew Roche is for you.

For anyone working with PowerApps at a high level within your enterprise, this is something you will want to see. It is an adoption maturity model put together by the Power Customer Advisory Team (CAT) at Microsoft.

Patrick LeBlanc goes through the logic of how to highlight multiple values. This is a great example of how to tinker with the DAX logic to get the desired result.

Alberto Ferrari walks through troubleshooting some DAX code by walking through the filter context. When troubleshooting DAX, this is such an important exercise. Here, the expert himself shows how to do it through a specific example.
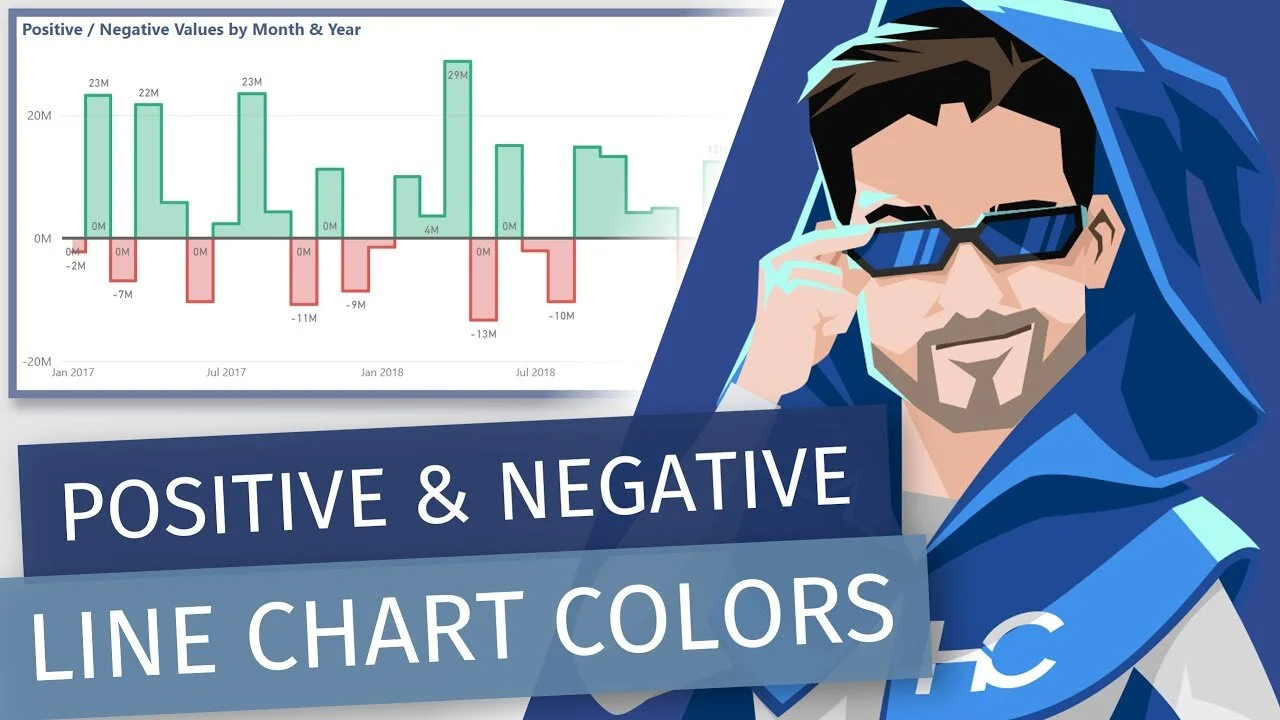
I thought this was a neat trick to color a line chart conditionally based on whether the number was positive or negative.