

In app-dev shops, two or more engineers can work on the same bit of code and see and merge changes through a tool called Git. Microsoft is bringing this experience, backed by Azure DevOps, to Power Apps Studio (as an experimental feature). This is great, and I just hope that they bring something similar to Power BI.

The November 2021 feature summary for Power BI is out!

If you have any page- or report-level filters on a report, it’s always a good idea to let your report consumers know what filters are in place. Patrick Leblanc shows you how to do that a couple ways, including by adding that information to the tooltip of a visual.

I’m really excited to see where this goes. Microsoft is essentially creating a programming language out of the code used in Excel, meaning that hundreds of millions of Excel users could potentially create no-code, low-code solutions.

If you need a Profit & Loss custom visual for Power BI, this could work for you.

For people who want to export data from a Power BI report to explore it in Excel, Microsoft is improving this capability by maintaining current layout, datatypes, and MIP.
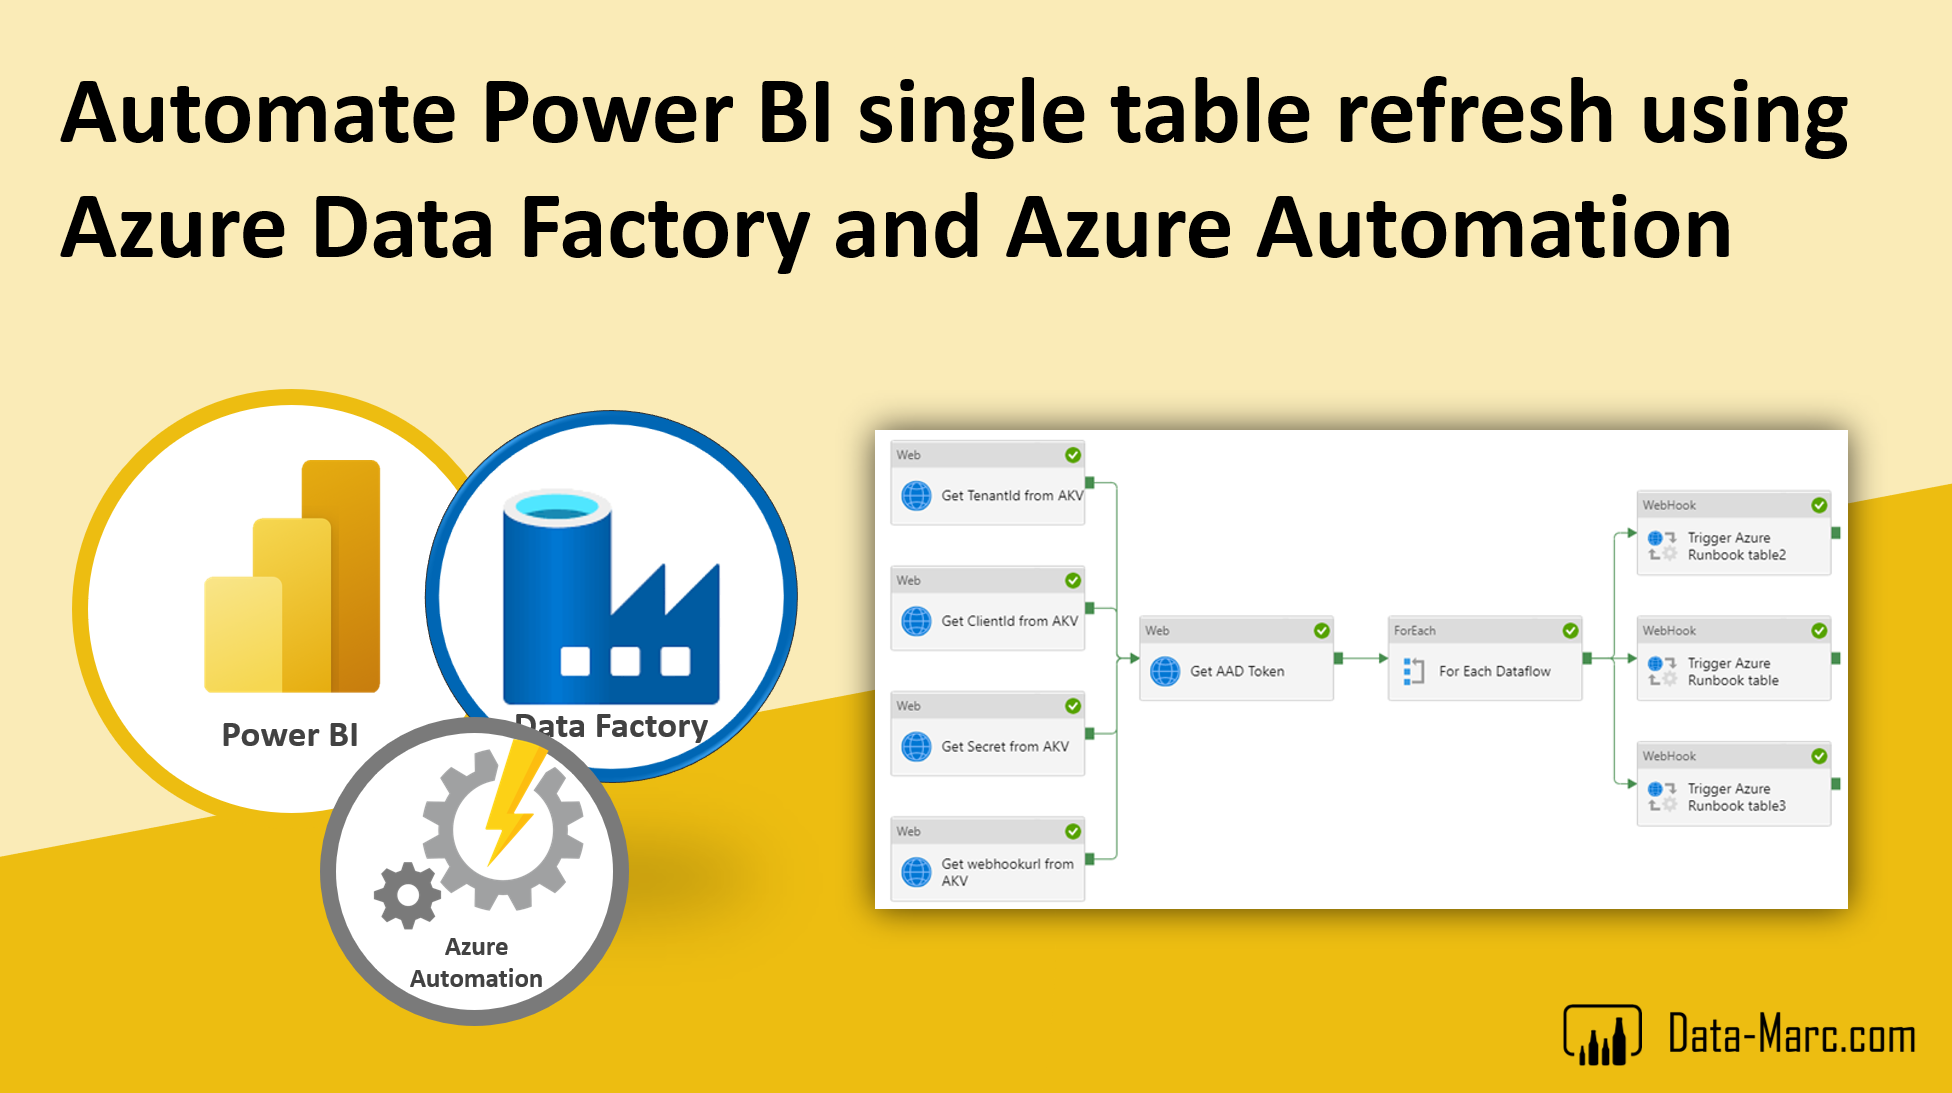
Marc Lelijveld has a great article about how to update a single table in your Power BI dataset, and you can use it to update the table after the data source’s ETL processes are complete. Really fascinating, if rather technical.

Now that Power BI Premium Gen 2 is Generally Available, it’s important to get the details. Adam Saxton has you covered. I didn’t realize that the 25-Gb limit is now for each given dataset and not for the total capacity of the node.