I don’t normally post things behind a paywall, but I enjoyed this article too much not to share it. This Economist article talks about how economists are using access to large, novel, realtime datasets to make surprising discoveries.
I didn’t realize this, but you can use a developer tool in Edge to emulate vision deficiencies when building out your Power BI reports.
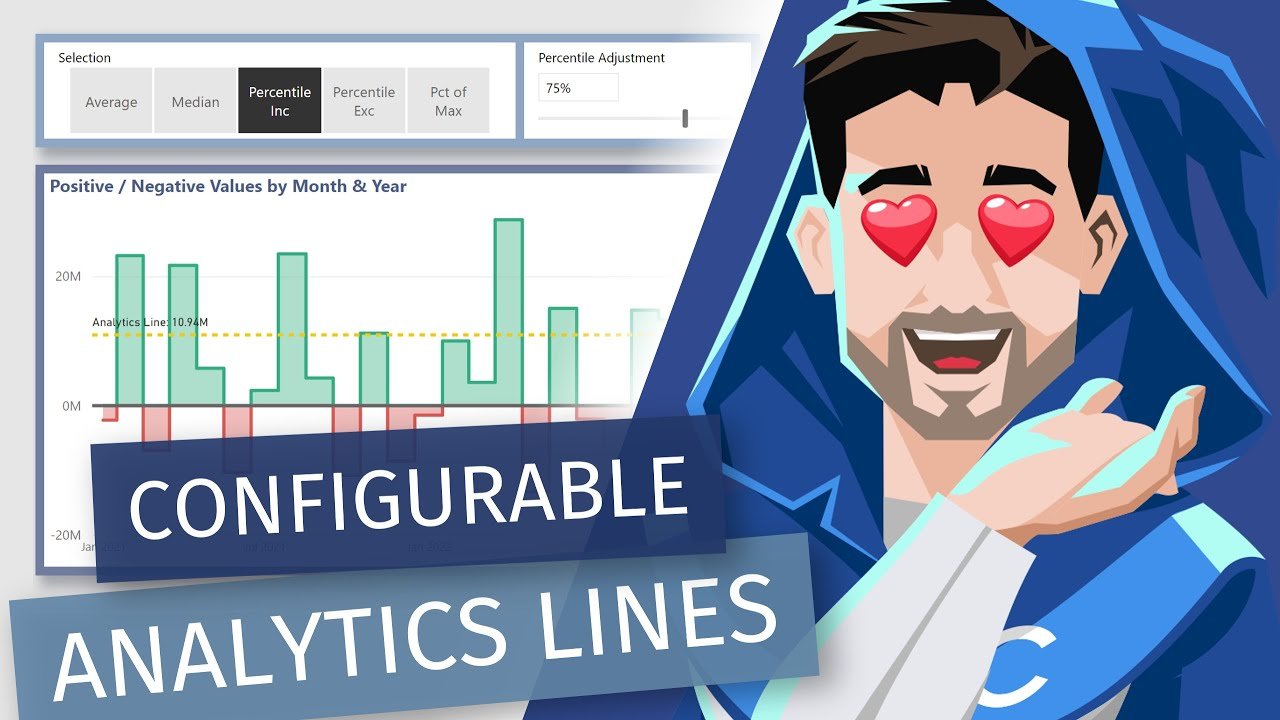
I thought this was a pretty slick way to have dynamic, configurable analytics lines in your native Power BI visuals. I can think of a bunch of places where I could make use of this.
I wish I had known about this trick this morning. I had to take over a Power BI dataset to fix some connections issues. This PowerShell solution would have simplified things greatly.
This is a foundational video, but if you need, or know someone who needs, an explanation on all those four hundred or so connectors within Power Query, then here you go.


