Weekly Roundup

Weekly Roundup for December 28, 2020

MK_logo_horizontal_rgb.png

I always advocate for the reusing of master datasets to the greatest extent possible. One limitation to the practical implementation of this strategy is an inability to see the datasets to which a user has access. Microsoft’s new Datasets Hub (currently in preview) should help add needed transparency.


Microsoft is releasing an invoice-processing feature in AI Builder. Can’t wait to try this!


You can now paste data directly into the Power BI Service.

Weekly Roundup for December 21, 2020

MK_logo_horizontal_rgb.png

The December 2020 update for Power BI is out!


Microsoft is releasing an invoice-processing feature in AI Builder. Can’t wait to try this!


I thought this was a great, quick tip by Soheil Bakhshi: adding SQL Server Profiler as an external tool in Power BI Desktop.


Many people, including myself, have been waiting for this update to Power BI: Small Multiples.


This has been referred to as the biggest update to Power BI since it was first released. Marco Russo called it the Holy Grail of BI. I don’t know if I would go quite that far, but this is definitely one of the biggest enhancements I’ve seen. You can now combine different types of data sources, like a Power BI dataset, an Excel file, and a table in SQL Server, and then layer your own metadata on top.


There is now a Dataflows connector within Power Automate. This means that you can programmatically run refreshes of your dataflows, for example, when an upstream data flow completes. You could have the successful completion of a dataflow trigger the refresh of a Power BI dataset. You could also have a dataflow refresh-failure trigger email notifications or the creation of a support card.

Weekly Roundup for December 14, 2020

MK_logo_horizontal_rgb.png

At the Nashville Modern Excel & Power BI User Group, we had a great presentation this past Friday by Alberto Ferrari about DAX calculation groups. If you missed it, you can catch a recording of it here.

https://mckcons.co/y3g


Power Automate just released a new Process Advisor, to help you document business processes, and enhancements to RPA, including lifecycle management, execution priority for desktop flows, real-time monitoring, and role-based sharing.


The Nashville Modern Excel & Power BI User Group now has a YouTube channel!


I thought this was a really neat, simple idea by Alberto Ferrari to take advantage of DAX calculation groups to very easily use inactive relationships in your model—for example, an inactive relationship between your Sales and Date tables.


If you’ve been hearing about Power BI Premium Per User and wondering what it’s all about, Angela Henry with BlueGranite gives you a comparison between Pro, Premium Per User, and Premium Capacity.


Microsoft recently released Purview to help organizations get a handle on their data. If you’ve been wanting a walkthrough for setting it up, Soheil Bakhshi has you covered.

Weekly Roundup for December 7, 2020

MK_logo_horizontal_rgb.png

Just a reminder that Alberto Ferrari will be presenting on DAX calculation groups this Thursday at 11:30 Central US to the Nashville Modern Excel & Power BI User Group. It's virtual and free, so be sure to sign up here: https://mckcons.co/npbiug202012


Microsoft put out a really interesting white paper on how to optimize your Power Apps apps. If you build even small apps, this is a must-read.


As your organization grows in maturity, it will need to standardize its operations and document how it is doing what it is doing. That means, among other things, keeping components in source control, and creating automated deployment mechanisms/scripts for those components. Marc Lelijveld has an improved PowerShell script to move multiple dataflows from one Power BI workspace to another.


Microsoft recently released Microsoft Purview, designed to help with data governance and discovery. This will be a great tool for any admins or data security officials responsible for securing their data or for making the most effective use of an organization’s data.


I’ve been waiting for this video for a while: Patrick LeBlanc shows you how to use DAX Studio to write DAX queries. Love it!


You can now attach an entire Power BI report to a subscription email in the Service.


Last chance to sign up to hear Alberto Ferrari present on DAX calculation groups today at 11:30 Central US time at the Nashville Modern Excel & Power BI User Group. It's virtual and free, so be sure to sign up here: https://mckcons.co/npbiug202012


Adam Saxton gives you a primer on the new Power BI user license Premium Per User.

Weekly Roundup for November 30, 2020

MK_logo_horizontal_rgb.png

Just a reminder that Alberto Ferrari will be presenting on DAX calculation groups at the Nashville Modern Excel and Power BI User Group on Thursday, December 10 at 11:30 AM CST. It's online, free, and open to the public. Be sure to sign up!


Leo Furlong at BlueGranite has Part 2 of an interesting series on Databricks in Azure. Notice the part about SQL On-Demand for serverless compute over a data lake.


Adding service principals to Power BI is way easier now than it used to be. Adam Saxton shows you how.


Reid Havens shows off the new anomaly detection visual in Power BI.


Adam Saxton has some great Power BI beginner suggestions:

  1. Star schema all the things

  2. Only bring in data that you need

  3. Use DirectQuery wisely…if at all

  4. Use variables in your DAX


If you’ve ever needed to sort by more than 1 column in RANKX in Power BI, Alberto Ferrari shows you how.


Reid Havens has a really neat way to have dynamic date-related columns headers in your Power BI reports, like “Current Month Remaining (Nov, 2020)” or “FM 1 (Dec, 2020)”. Give it a gander. Give it a try.


If you’ve wanted a primer on the new Visual Data Prep in Power BI Dataflows, Patrick LeBlanc walks you through it.

Weekly Roundup for November 23, 2020

MK_logo_horizontal_rgb.png

Alberto Ferrari will be speaking about DAX calculation groups at the Nashville Modern Excel & Power BI User Group. Be sure not to miss it!


Power Apps is now using layout containers to make it easier to build responsive apps—that is, apps that move things around as the app is resized. These have been tedious in the past. This should make them considerably easier to build and maintain.


I thought this piece about allowing your users to pick their time zone by John White was really useful.


DAX Studio is a really great tool to troubleshoot your DAX. If you are constructing Power BI models, you really should be using it. Patrick LeBlanc shows you why.


Marco Russo gives a detailed, but concise, explanation of how the storage engine and formula engine work in Power BI. If you want to know how to make more complex DAX queries or how to optimize your DAX queries, this video is must-watch.


Back to Basics: Patrick LeBlanc shows you how to use dynamic images in Power BI.

Weekly Roundup for November 16, 2020

MK_logo_horizontal_rgb.png

I don’t know how many times I’ve had to create a model with a bunch of columns I wanted to rename, and I’ve already renamed several of them before in past models. It can be a bit frustrating. Soheil Bakhshi has a way to make this much easier.


The Power BI Premium Per User public preview is now available.


Sawyer Nyquist at BlueGranite has a really interesting article about building Proofs of Concept in data analytics solutions.


The November 2020 Feature Summary of Power BI is out!


Patrick LeBlanc has a great video showing you how to perform a schema-only update to a dataset you have already published to the Power BI Service.


I really like this diagram view for Power Query Online. Can’t wait for Microsoft to bring this to Power Query desktop.


Adam Saxton talks about why you should be thinking about data protections in Power BI and how to implement that.


I can’t wait to play with the new anomaly detection feature for line charts.


Matthew Roche continues his series on data culture by discussing the place of data strategy within the overall data analytics enterprise. I really enjoy these videos!


Because I haven’t used KPIs much in my models, I don’t have great familiarity with them, so I was glad to see this video / article by Marco Russo.

Weekly Roundup for November 9, 2020

MK_logo_horizontal_rgb.png

Patrick LeBlanc shows some great ways to blend paginated reports with standard Power BI reports.


I’ve been getting more and more interested in the use of data lakes in business intelligence. Chris Webb recently hosted a talk on combining Power BI and Snowflake.


I love the integration of Power BI into Microsoft Teams. Adam Saxton shows you everything you need to know!


I love these data culture videos! Matthew Roche describes how measure to the success of your new BI solution. (Hint: You should probably be thinking about this before you get started.)


CSG has a great list of 5 dos and don’ts for anyone getting started with Power Apps. I thought this was a really good list.


In case you didn’t know, you can use the same custom format string configurations that you use in Excel in Power BI, as well. If you aren’t familiar with that, Matt Allington shows you how it’s done!


Reid Havens has a great use of the new Smart Narrative visual in Power BI within report tooltips.


Darren Gosbell has released a new version of DAX Studio. Be sure to upgrade. You can read his blog post about it here and download it here.


Alberto Ferrari just figured out how to aggregate values and set dynamic format strings using DAX. Once again, my mind is blown.


I always try to minimize the number of steps I take in Power Query by combining them, for example, or just generally being more thoughtful about what I’m trying to achieve during the ETL. I should have created a blog post about that one ages ago, but Erik Svensen beat me to it!

Weekly Roundup for November 2, 2020

MK_logo_horizontal_rgb.png

Users can connect Power BI to Azure Databricks via a native connector. This means that you can now query massive datasets without having to import everything into Power BI directly. Also, SSO will pass through the Power BI Service to Databricks and respect whatever data lake-level security you already have in place.


Gregory Petrossian at CSG has an interesting juxtaposition of Power BI and Tableau. (Hint: Power BI wins! Still worth reading though, if you're considering which platform is right for you.)


You have, for some time, had the ability to certify and promote datasets within your organization. This reduces data siloing, memory footprint, divergent algorithms, and duplicative effort spent creating and maintaining ETL and datasets. You can now, also, certify and promote reports and apps, meaning that you can have one source of truth end-to-end for your BI solutions.


Reid Havens shows you how to use Maintain Layer Order to keep visuals from popping in front of one another when you click on them. If you spend any time designing reports in Power BI, you know exactly how frustrating this can be. Be sure to give it a watch!


I’ve built offline Power Apps before, but this builds the capability right into CDS. This will likely make the process much simpler and more robust.


Marco Russo recently discussed with the London Power BI User Group all about the state of external tools for Power BI. If you are doing any amount of advance Power BI work, or just want to take the Power BI work you’re already doing to the next level, this is a must-watch!


Patrick LeBlanc has an idea for a neat visual trick that allows users to conditionally highlight a bar in a Power BI report. It uses a disconnected table and synced slicers.


Going back to basics for a moment, if you ever wondered what a data model is, or why it’s needed, here is a great introductory article by Matt Allington.


I love these network graphs! They are really useful from time to time. Adam Saxton shows you how to create them in Power BI.


I’ve said it before, I’ll say it again: when designing your data model, be sure to rationalize your data against your business requirements. Do you need the table? Do you need the columns? Do you need the rows? If you aren’t reporting on certain characteristics or aren’t reporting on the entire history of your dataset, don’t bring in the data that is unnecessary. Reid Havens explains.

Weekly Roundup for October 26, 2020

MK_logo_horizontal_rgb.png

The October 2020 update to Power BI Desktop is out! Be sure to check it out.


In case your were interested in using the Power Automate Desktop tool, you can find several Microsoft-created “Getting Started” videos.


Adam Saxton has 3 tips for improving the performance of your Power BI report refreshes.


AI Builder capabilities in Power Automate are now generally available. This will be really helpful for anyone who wants to automatically process invoices, for example. There are tons of use cases.


Patrick LeBlanc has 5 great tips to take into account whenever creating a report in Power BI. Give it a watch!


I really enjoyed this video (and article) from Matthew Roche (aka BI Polar). He talks, at a strategic level, about how not every BI solution needs to be made into an enterprise-grade “production” solution and about how to think about that distinction.


Marco Russo has a really neat and simple trick to improve your date tables in Power BI that will eliminate the need for sort-by columns.


Marc Lelijveld has an interesting article explaining how to query session metadata via the XMLA endpoint. This is strictly for admins of a tenant with Premium capacity, but I could see all kinds of use cases.


Reid Havens has a video with an interesting way to animate buttons using animated GIFs. I liked the Millennium Falcon one!


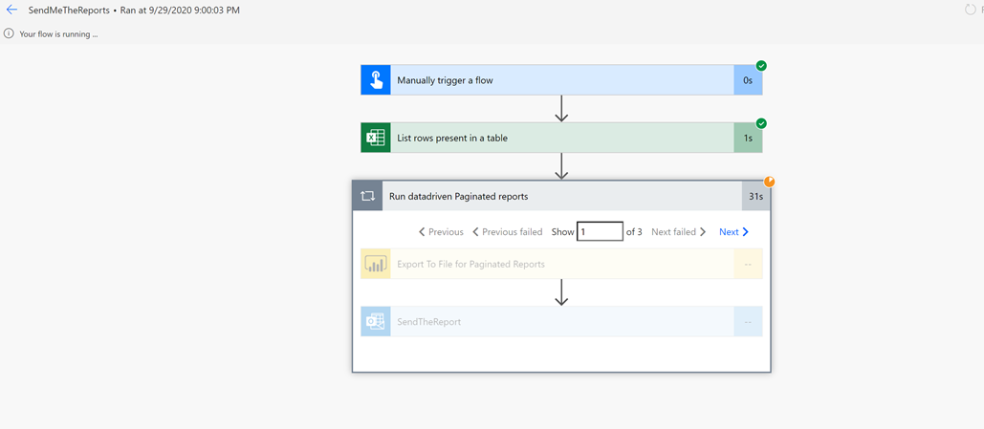
I thought this was a great idea for setting up data-driven paginated report subscriptions. This is important when you have a lot of paginated reports that you manage. I could envision some great use-cases by incorporating PowerShell or logging. Also, being a SQL person myself, that’s probably where I would store the information.


One of the biggest factors in the success or failure of Power BI (or, really, almost any new tool) within an organization is the culture around that new tool. Matthew Roche is one of the few (maybe only) people communicating on this very important topic, and I’ve really enjoyed sharing in his wisdom.